Blog-Strategies for Designing Data Dashboards
As data dashboards increasingly become vital tools in business and decision-making contexts, their design strategies continue to evolve.
10/19/20242 min read
1. Background of Data Dashboards
1.1 Data Visualization
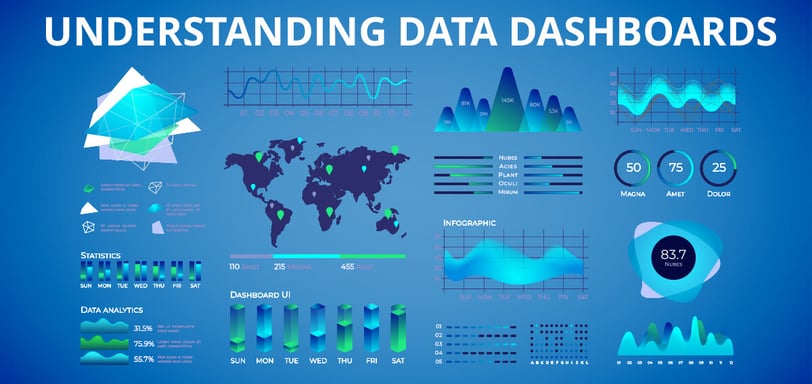
Data visualization translates abstract data into tangible visual representations, making it accessible, shareable, and interactive. This process effectively conveys the inherent information and patterns in data, facilitating practical applications.
1.2 Data Dashboards
Data dashboards leverage large screens as the primary display medium to support information sharing and decision-making. Their main functionalities can be grouped into the following categories:
Data Display: Presents multidimensional data with real-time updates and historical trends.
Data Analysis: Illustrates relationships and trends through visualization to enhance insights.
Monitoring and Alerts: Tracks data in real-time and sends alerts to address issues promptly.
1.3 Target Users
Senior Decision-Makers: Offers core data to aid strategic decision-making.
Enterprise Branding: Provides intuitive data displays to enhance brand impact.
2. Design Process
2.1 Design Principles
Effective dashboard design adheres to these principles:
User-Centric Approach: Tailor the design to business goals and user needs.
Overview Before Details: Prioritize critical data and allow for detailed exploration through interaction.
Storytelling: Connect data points to present trends and narratives.
Readability: Ensure clarity and simplicity in data structure and presentation.
Interactive Experience: Incorporate real-time monitoring, multidimensional analysis, and data queries.
2.2 Key Steps
Business Context Research
Identifying Needs: Define target users and usage scenarios.
Analyzing Current State: Understand existing workflows and data applications.
Anticipating Future Trends: Prepare for evolving business demands.
Deliverables: Develop detailed business flowcharts and identify key metrics.
Defining Business Metrics
North Star Metric: Establish a primary indicator that reflects strategic direction.
Supporting Metrics: Expand on the core metric with additional relevant indicators.
Analytical Dimensions: Specify dimensions and calculation formulas to ensure actionable metrics.
Types of Metrics: Include dimensional, atomic, and composite metrics.
Data Sourcing and Processing
Data Tracking: Map metrics to corresponding data sources.
ETL Processes: Extract, transform, and load data while ensuring accuracy and consistency.
Outputs: Provide data exploration and integration reports.
UI Design
Styling: Choose design styles based on industry requirements (e.g., high-tech or business-oriented).
Page Layout: Organize structure for clarity, with distinct hierarchies.
Chart Selection: Use intuitive visualizations aligned with design goals.
Prototype Development: Progress from low-fidelity sketches to high-fidelity designs.
Visualization Implementation
Utilize tools like FineReport, Power BI, Tableau, or custom data platforms to deliver the final dashboard.
3. Core Functionalities
3.1 Data Display
Provide real-time and historical data views, focusing on:
Accuracy and timeliness
Filtering and sorting options
Optimized layouts and color schemes
Anomaly detection
3.2 Interaction
Support interactive features (e.g., touchscreens and mouse inputs) that include:
Intuitive operations
Feedback mechanisms to prevent errors
Dynamic interactions and multi-device adaptability
3.3 Data Analysis
Incorporate robust analytical tools to support filtering, sorting, comparing, and ranking data, enhancing decision-making capabilities.
3.4 Alerts and Monitoring
Enable alerts based on predefined thresholds to identify issues promptly:
Adjustable thresholds
Real-time notifications and anomaly detection
Historical analysis to refine alert criteria
3.5 System Integration
Seamlessly integrate with ERP, CRM, and other enterprise systems for data synchronization:
Cross-system data sharing
API support for connectivity
Compatibility with third-party tools (e.g., enterprise communication platforms).
Conclusion
Data dashboards have become integral to enterprise operations and decision-making due to their intuitive displays and analytical power. By adhering to scientific design strategies and implementing comprehensive functionalities, data dashboards maximize the value of data and support business growth effectively.